The 2016 Hamptons Home Sales Market closed out with a thud. In fact, the full report is covered with lots of RED!
Only 3 of the 12 markets monitored by TOWN & COUNTRY experienced an increase in the Number of Home Sales. Shelter Island had the greatest statistical change of +16%, from 73 to 85, year over year. Westhampton (which includes Remsenburg, Westhampton Beach, East Quogue, Quogue and Quiogue) still logged in the most Number of Home Sales with 318 — a slight difference from 2015’s count of 324.
Bridgehampton (which includes Water Mill and Sagaponack) had the greatest pullback with -27%, totaling for the year only 172 sales, a far cry from 237 in 2015. The Sag Harbor Area (which includes Noyack and North Haven) Total Home Sales Volume shot up 45% from $186 million to $271million year to year. But Bridgehampton (which includes Water Mill and Sagaponack) remained #1 for Total Home Sales Volume with $701million trading hands in 2016, though quite a dip (-32%) from 2015’s impressive $1Billion dollar volume.
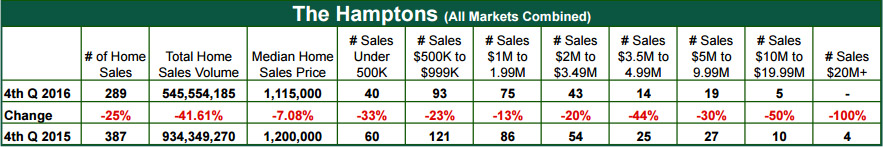
Half of the markets monitored by TOWN & COUNTRY realized increases in the Median Home Sales price by as much as 25% in Sag Harbor Village from $1.2 million to $1.5 million, 2015 to 2016. East Hampton Village, on the other hand, sank 37% from $3.8 million in 2015 to $2.4 million in 2016. Looking at All Hamptons Markets Combined and the RED is glaring — losses nearly across the boards. In fact the $10-19.99 million price range dropped 32% year over year.
The good news is 2017 is poised to be a much better year than 2016. All indicators point to increased activity. All 8 TOWN & COUNTRY offices are reporting more inquiries and greater traffic flow at Open Houses.
To view all reports visit http://www.townandcountryhamptons.com/html/marketReports.php.