
The US Real Estate Market – Nationally – good news!
“Fueled partly by an increase in the share of sales to first-time buyers, existing-home sales increased in May to their highest pace in nearly six years”, according to the National Association of Realtors®. “Led by the Northeast, all major regions experienced sales increases in May” said NAR Chief Economist Lawrence Yun.
This article in RIS Media explores the importance of Millennial buyers in this Real Estate Market.
Good news: May home sales rebounded strongly following April’s decline and are now at their highest pace since November 2009 (5.44 million). “Solid sales gains were seen throughout the country in May as more homeowners listed their home for sale and therefore provided greater choices for buyers,” he said. “However, overall supply still remains tight, homes are selling fast and price growth in many markets continues to teeter at or near double-digit appreciation. Without solid gains in new home construction, prices will likely stay elevated — even with higher mortgage rates above 4 percent.”
On a national level, in other words, absence of newly built housing accounts for much of the low inventory, and Mr. Yun continued: “Total housing inventory2 at the end of May increased 3.2 percent to 2.29 million existing homes available for sale, and is 1.8 percent higher than a year ago (2.25 million). Unsold inventory is at a 5.1-month supply at the current sales pace, down from 5.2 months in April”.
NAR reported that The median existing-home price for all housing types in May was $228,700, which is 7.9 percent above May 2014. This marks the 39th consecutive month of year-over-year price gains.
The percent share of first-time buyers rose to 32 percent in May, up from 30 percent in April and matching the highest share since September 2012. A year ago, first-time buyers represented 27 percent of all buyers.
According to Freddie Mac, the average commitment rate for a 30-year, conventional, fixed-rate mortgage climbed in May to 3.84 percent from 3.67 percent in April but remained below 4.00 percent for the sixth straight month.
With demand continuing to far exceed supply, properties typically stayed on the market (DOM) for 40 days in May, up from April (39 days) but the third shortest time since NAR began tracking in May 2011. Short sales were on the market the longest at a median of 131 days in May, while foreclosures sold in 56 days and non-distressed homes took 38 days. Forty-five percent of homes sold in May were on the market for less than a month.
All-cash sales were 24 percent of transactions in May for the third straight month and are down considerably from a year ago (32 percent). Individual investors, who account for many cash sales, purchased 14 percent of homes in May, unchanged from last month and down from 16 percent in May 2014. Sixty-seven percent of investors paid cash in May.
Distressed sales — foreclosures and short sales — remained at 10 percent for the third consecutive month in May and are below the 11 percent share a year ago. Seven percent of May sales were foreclosures and 3 percent were short sales. Foreclosures sold for an average discount of 15 percent below market value in May (20 percent in April), while short sales were also discounted 16 percent (14 percent in April).
Regional Breakdown
May existing-home sales in the Northeast jumped 11.3 percent to an annual rate of 690,000, and are now 11.3 percent above a year ago. The median price in the Northeast was $269,000, which is 4.8 percent higher than May 2014. Again great news from NAR.
The New York State Association of Realtors® published the latest skinny market report video and more data in a PDF on New York State and Suffolk County Real estate data. Take away: the NY market is stable, doing especially well in the high end and luxury end of the market.
Million Dollar Listing (Bravo) mentioned that even in Los Angeles the luxury market is driven by NY City buyers –whose success comes mostly in finance ( bankers hedge fund) and Entertainment. New York City in many upper end markets is booming! Of course – this is of a major consequence to the East End markets – and it is good news. If New York City does well – typically the East End does well.
But All Real Estate is Really Local
While the National and regional good news translates into a much better Real Estate Market on the East End than after the 2007 recession, it is important to distinguish the Local Market date from the National data to get a useful idea of what and how the Real Estate Market is doing on the East End, in the Hamptons and on the North Fork & Shelter Island.
The Hamptons is traditionally very well known as the playground of the rich and famous, tied to Manhattan New York City and also internationally buyers and sellers. The North Fork is increasingly grabbing attention as a popular Farm to Table lifestyle and vineyard region, with increasing buyer demand. While each market behaves intrinsically different, the entire East End behaves more and more as one market with the characteristics of a Resort and Second Home market. Mostly a “want to buy” rather than a “I have to buy” market.
In such markets, different than National and other regional markets, distressed Real Estate (Short Sales and Foreclosures) plays a much smaller role, even more so East of Riverhead than West.
One of the most important characteristics of the East End market is its seasonality. Harsh winters can slow certain months down, and create pent up spike demand later. Being able to use the new home in summer stresses the importance of closing before July, creating a spike just before in March-May, and then again as lots of people are out during the summer, with lots of closings 2-3 months later.
Exact listing data on the exact number of the Hamptons listings are harder to come by.

Judi Desiderio’s East End Market reports
A few companies report on market data. Judi Desiderio (Town and Country Real Estate CEO) so publishes a authoritative quarterly market report for the Hamptons, Shelter Island and North Fork providing clear data and analysis. 2014 year end reports for the Hamptons and North Fork show a robust recovery while first quarter reports for the Hamptons and North Fork reflect seasonality. Such reports show another important difference with national and other regional markets: a median sale of $950K+ in the Hamptons – creating very different market dynamics than lower priced markets. Such higher median prices typically cause listings to take longer to sell than national averages, as mentioned before.
So too on the North Fork: a very different RE market. It is of crucial importance to know how to read national and regional Real Estate data into the local market conditions.
The North Fork today –contrary to what you typically read- has normal levels of inventory, not much lower than normal. The MLS (which is not as important in the Hamptons) shows around 450-475 listings on the North Fork (seasonally low in winter around 375, highest I saw in 2009 at 520). Agents perception of their own listings, however, with more competing agents joining their ranks as the economy is improving, maybe misleading and allude to a really non-existing scarcity of available homes for sale and may lead to incorrect pricing of homes. While DOM (Days on Market) improved drastically to 90-120 days for the North Fork – this number is still much higher than national averages.
The East End RE market so behaves very differently from the National and even regional New York State and even Suffolk County markets in some important respects.
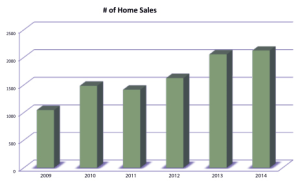
When looking at the North Fork markets specifically, it is interesting to watch how different price segments behave – and similar differences in the different price ranges can be observed in Judi Desiderio’s market reports.
Based on Contract signed in 2015 (data from MLSLI in selected North Fork hamlets and towns)– this is a first publication of my findings for this year – to date:
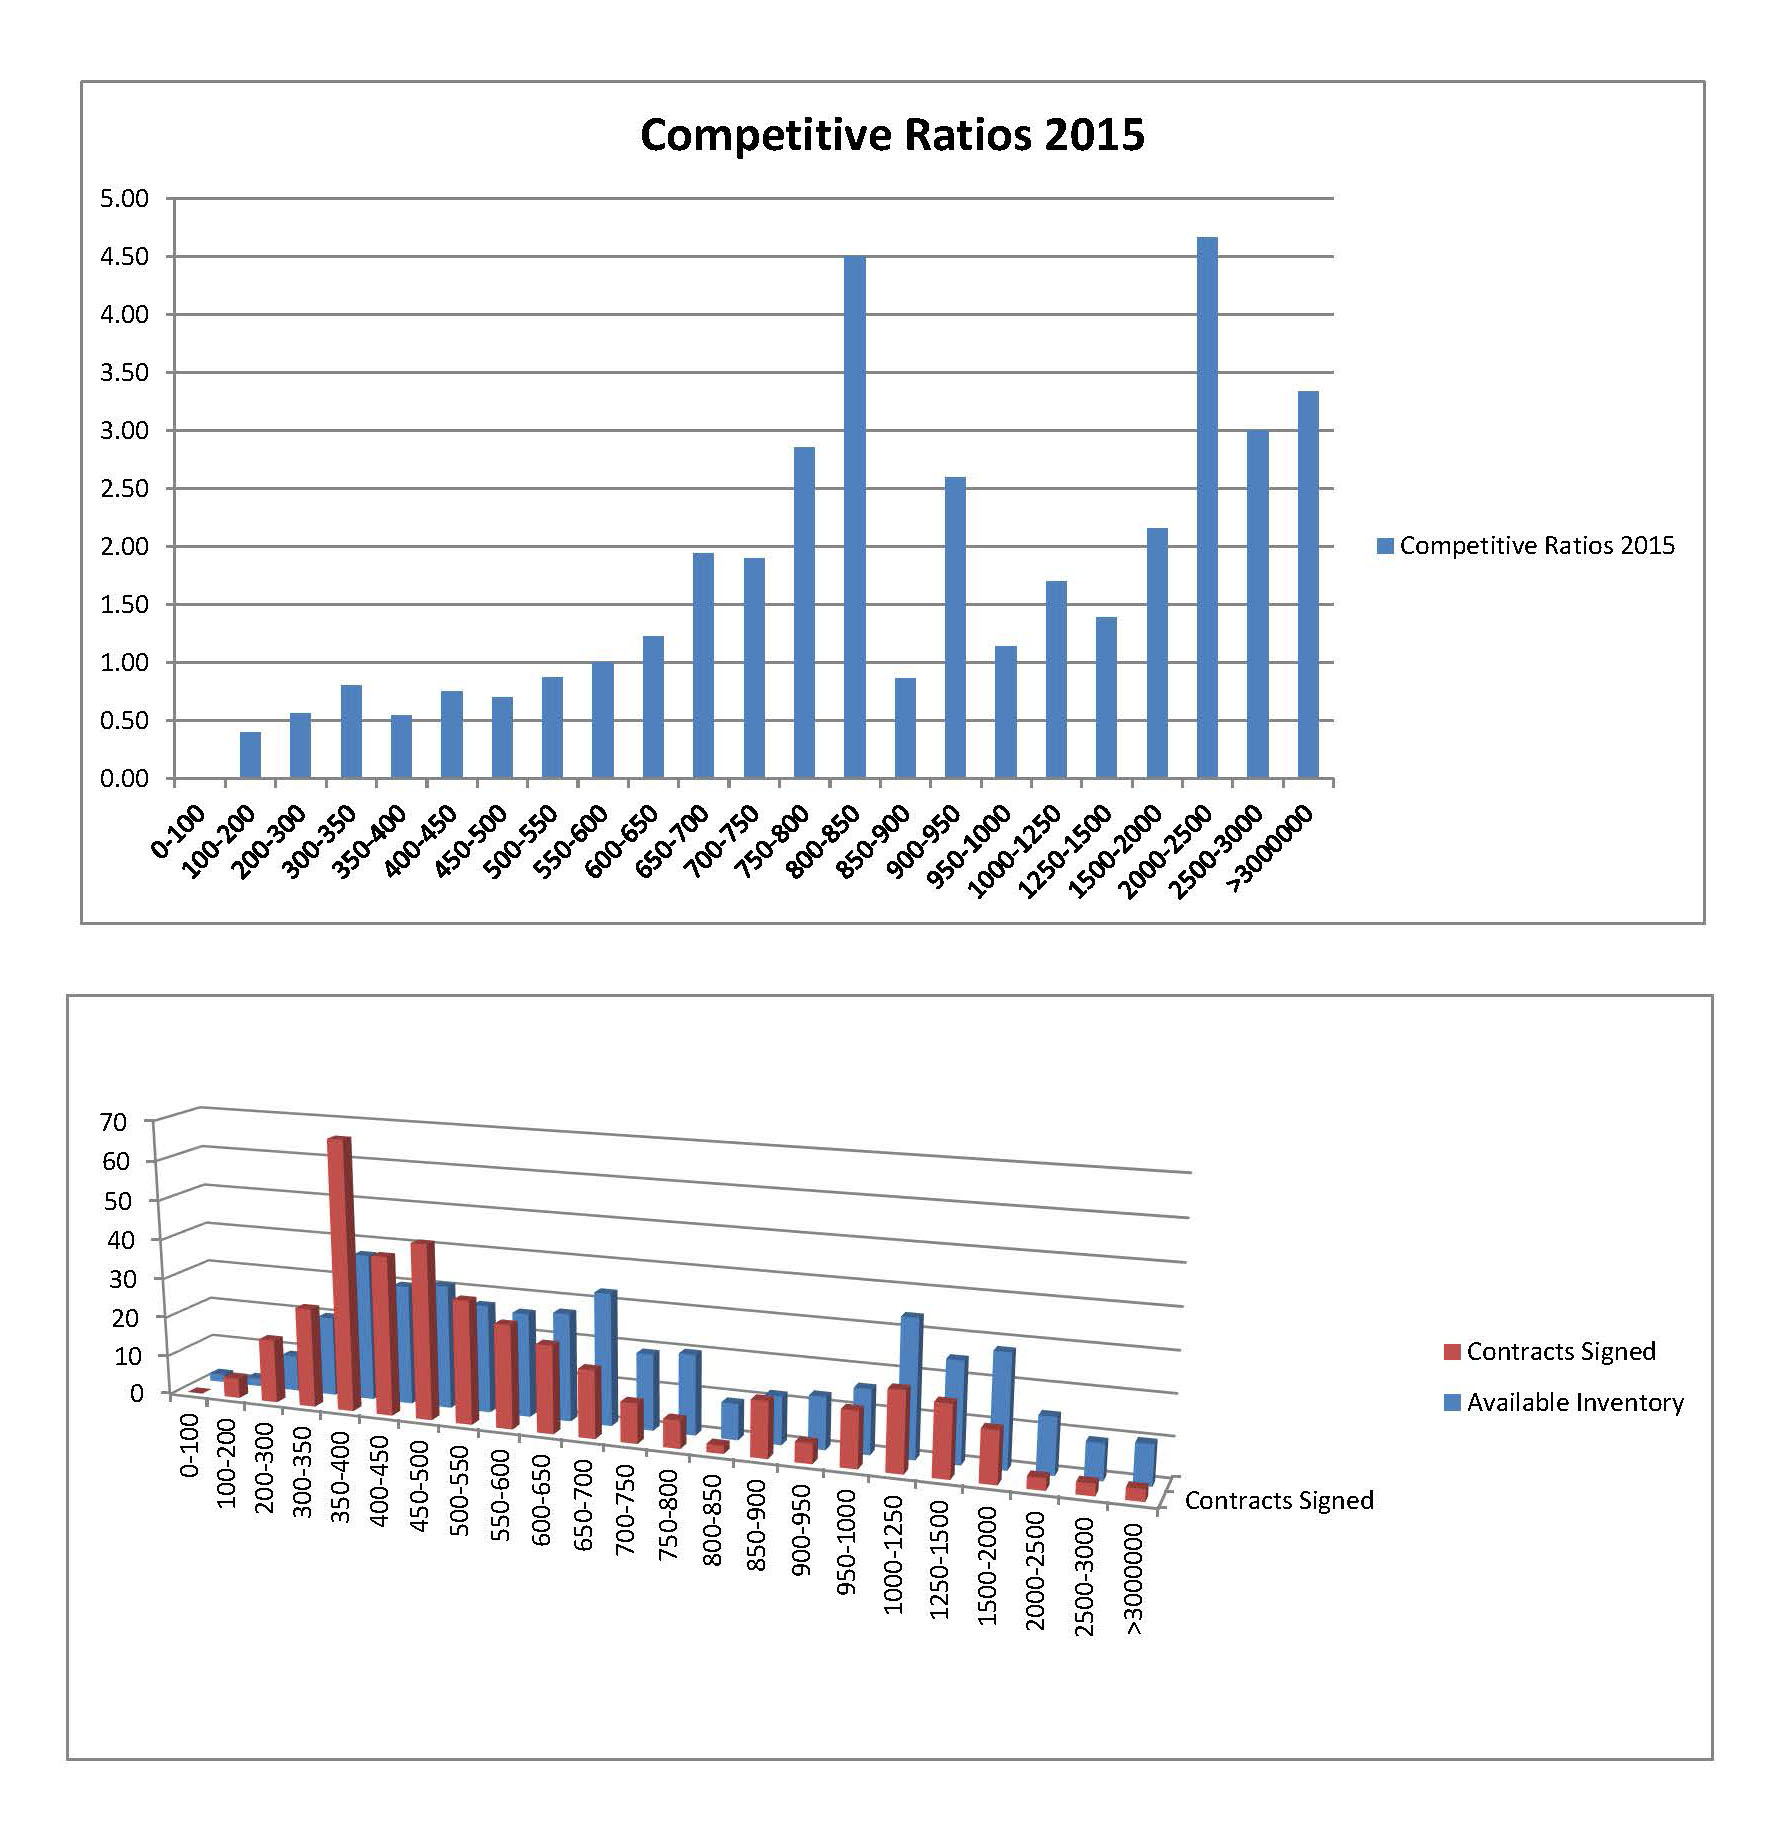

This graph shows how vastly differently stats for homes in different price ranges behave.
This is what a Realtor ® Pro can do for any consumer buying or selling Real Estate in the East End: make sense of national and regional RE data – and apply them locally – and to a specific buyer’s or seller’s property. An agent properly chosen can help any buyer or seller with reasonable expectations based on facts, and provide an accurate picture of national, regional and local statistics on the Real Estate market. The right agent can analyze all these data based on his or her knowledge, experience, hard work and become a valuable resource for anyone involved in the Real Estate market.
Depending on the different characteristic of a home, or a buyer or seller, the perfect choice for the Realtor ® to be chosen may so vary. So call any of the agents at Town and Country Real Estate to make sense of national, regional and local RE statistics – and price your home right for the market, limit guessing about your expectations, but rather make educated decisions and create the elements for a successful transaction.
Joan Bischoff van Heemskerck,
NY State Lic.Associate RE Broker
Executive Sales Director Town And Country North Fork & Shelter Island
Mobile: 631 948 0234 jbischoff(at)townandcountryhamptons(dotted)com